04
Maximizing Sales One Centimeter at a Time

THE PROBLEM
Mars Petcare had a smaller number of SKUs compared to the main competitor and Italian market leader Nestle Purina, but, had several high performing innovations struggling to gain distribution due to the limited available space on shelf. We needed to find a different way to gain market share without falling into the trap of price promotions.
THE SOLUTION
We equipped the sales and customer teams with TRAINING and DATA. The training was on all the major category levers. Distribution, Assortment, Shelf Space, Placement, Visibility, Price and lastly promotion.
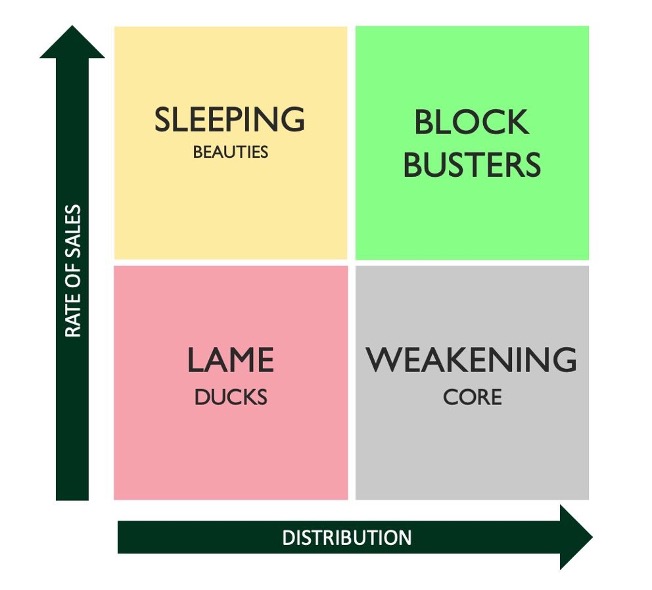
We introduced the Product Quadrant Analysis ( PQA picture above) powered by store data and used to identify which SKUs where best performing ( Sleeping beauties and Block Busters) that needed to receive maximum focus and distribution across all market and client clusters. The PQA maps SKUs in a matrix of Value Rate of Sales and Distribution, it is a very actionable tool to boost portfolio performance by providing clear data on the actions to take. For Example when the Rate of Sales are above market average, but the Distribution is below (Sleeping Beauty) the action is to invest in distribution. OR when your Rate of Sales are below average (Lame Duck), before expanding to more customers, the action is to invest in increasing rate of sales through trial driving mechanics.
THE RESULT
The relentless application of this tool, coupled with the laser focus on the category levers enabled Mars Petcare to maximize availability of its best performing SKUs and closed the market share gap with the Leader.
